

Quick start
This guide walks through configuring a chart from scratch using the essential features. Optional capabilities are covered in later chapters.
Prerequisites:
- A data source and collection (table) are set up, and you have read permission.
Add a chart block
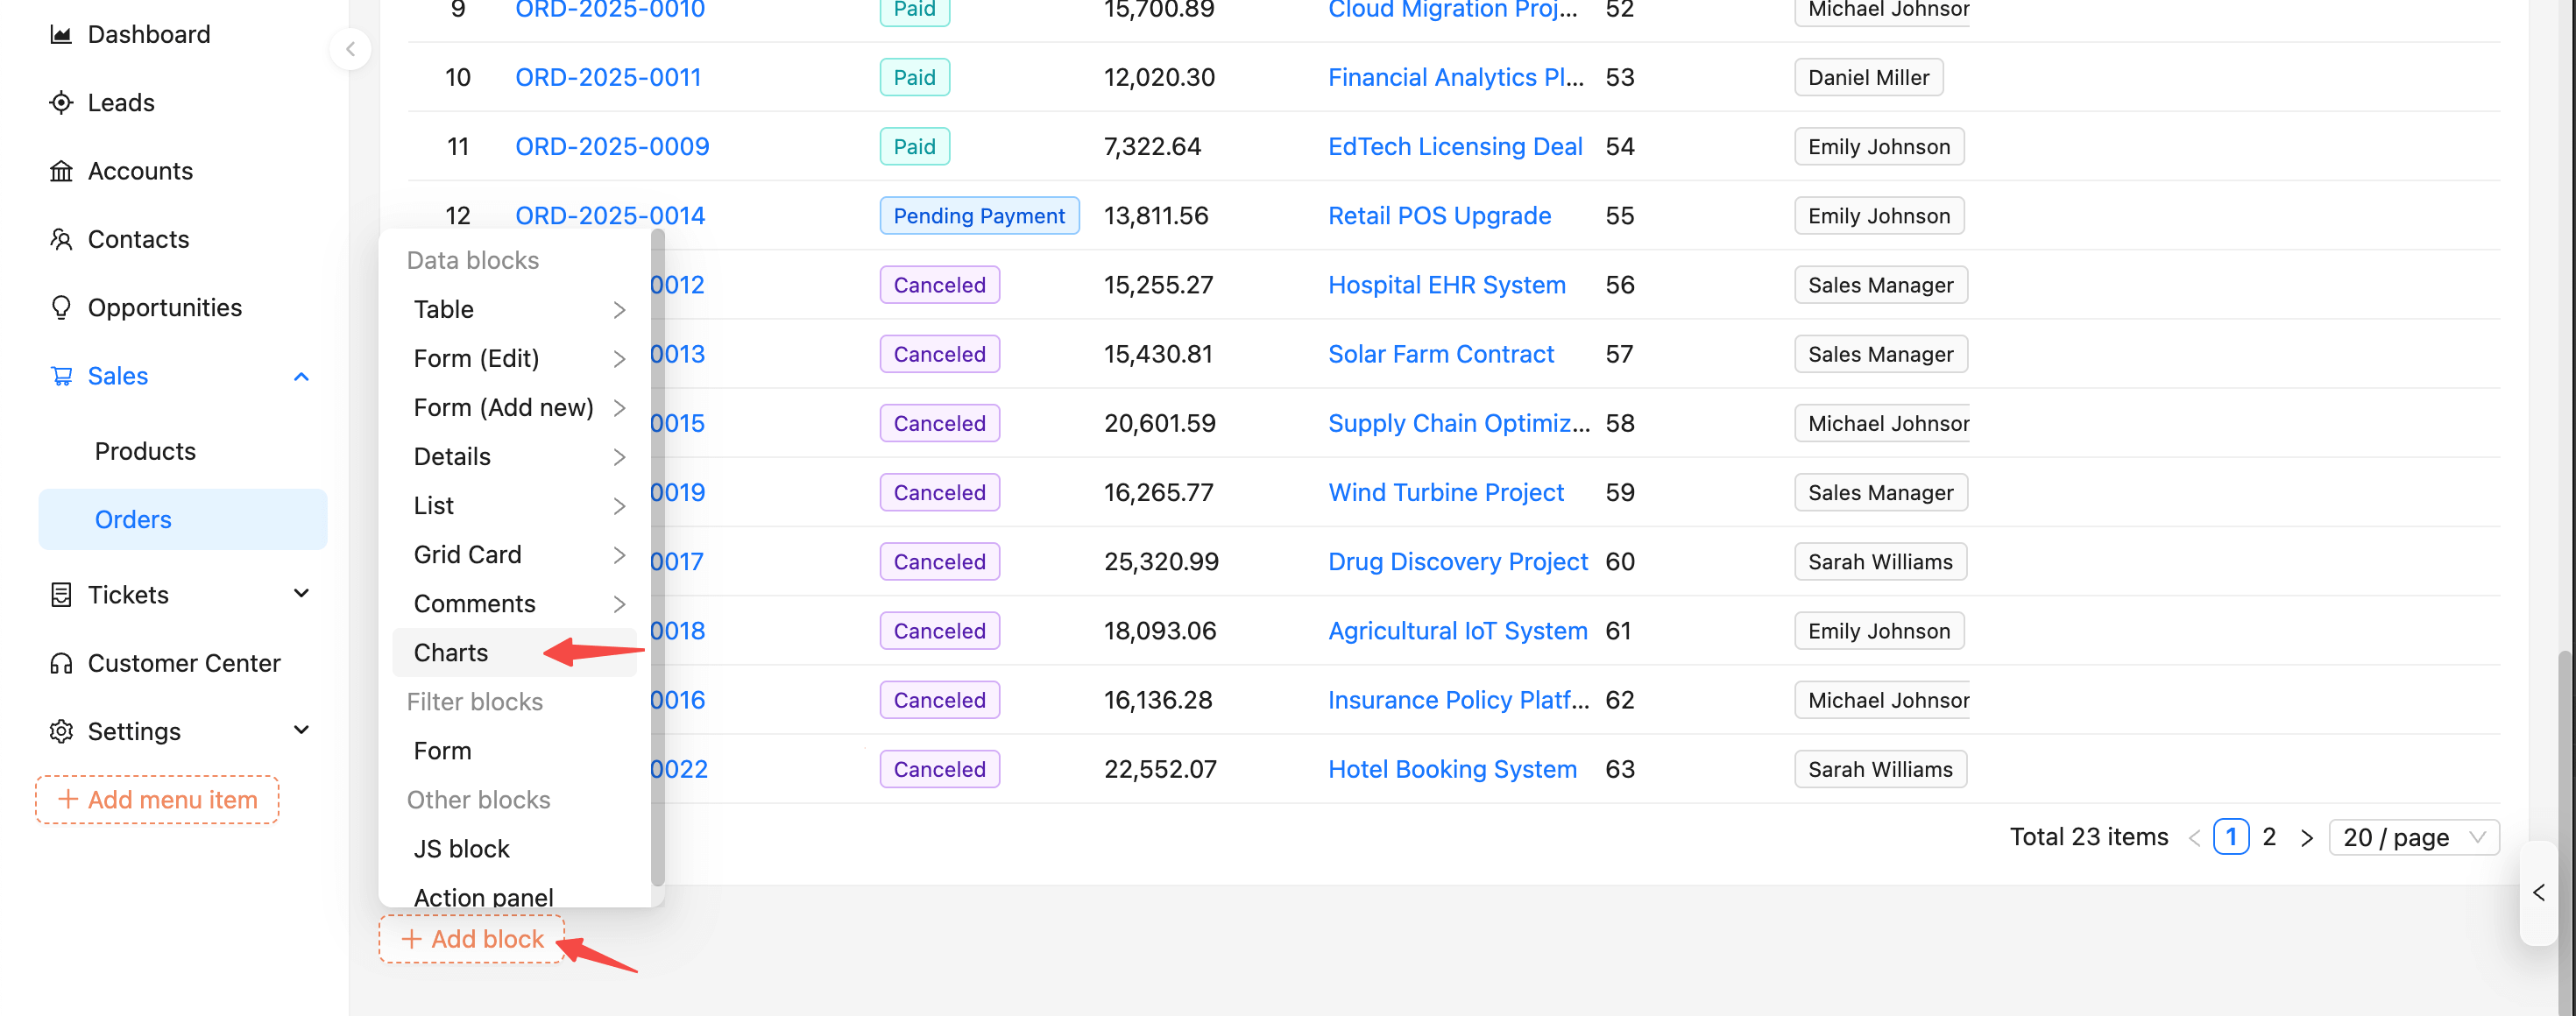
In the page designer, click “Add block”, choose “Chart”, and add a chart block.
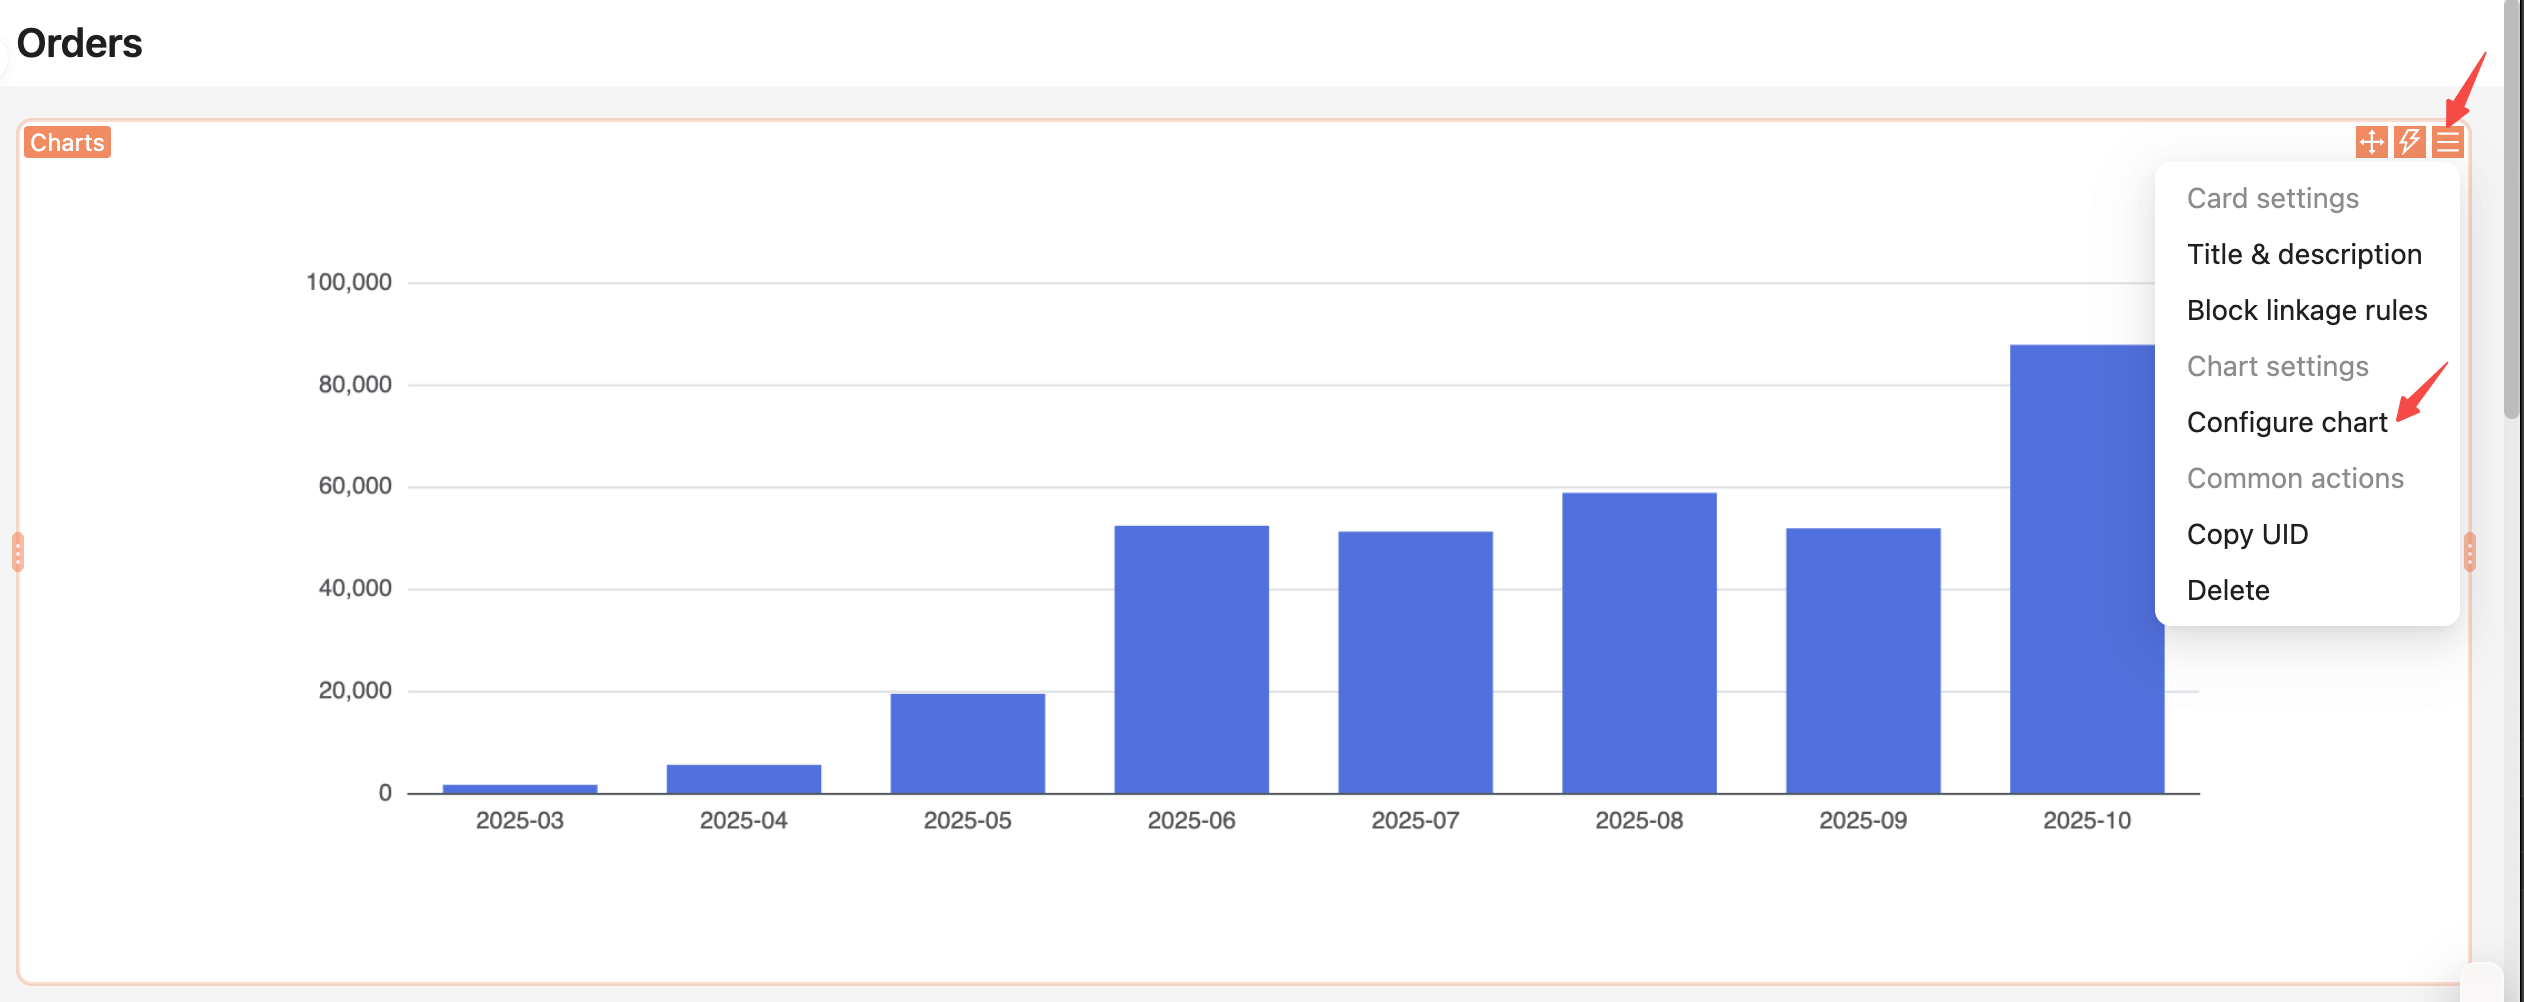
After adding, click “Configure” at the top‑right of the block.
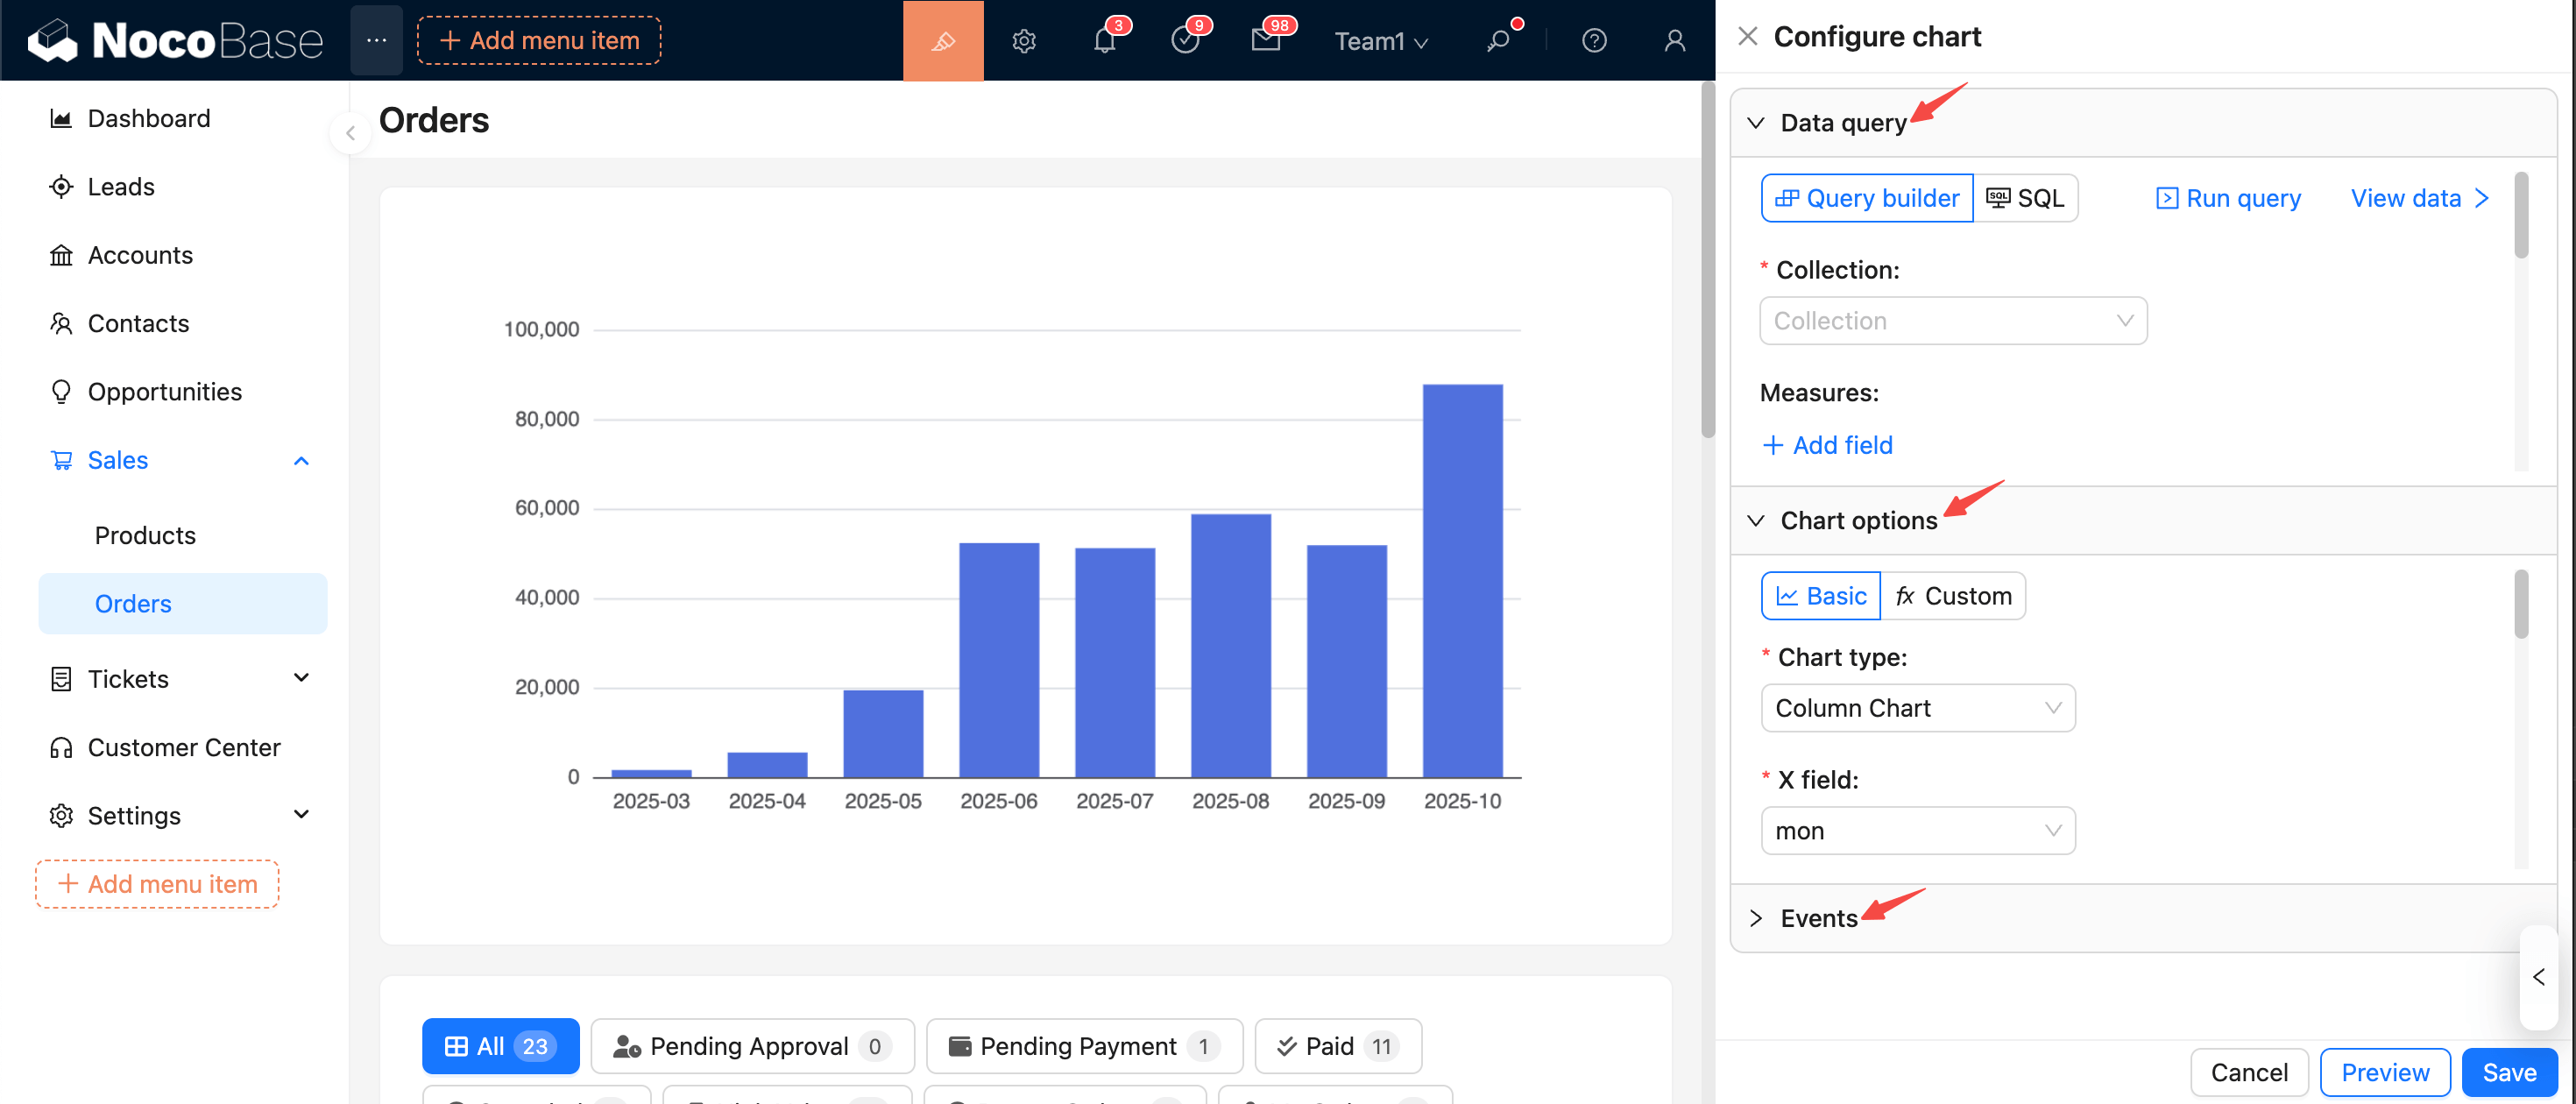
The configuration panel opens on the right. It includes three sections: data query, chart options, and events.
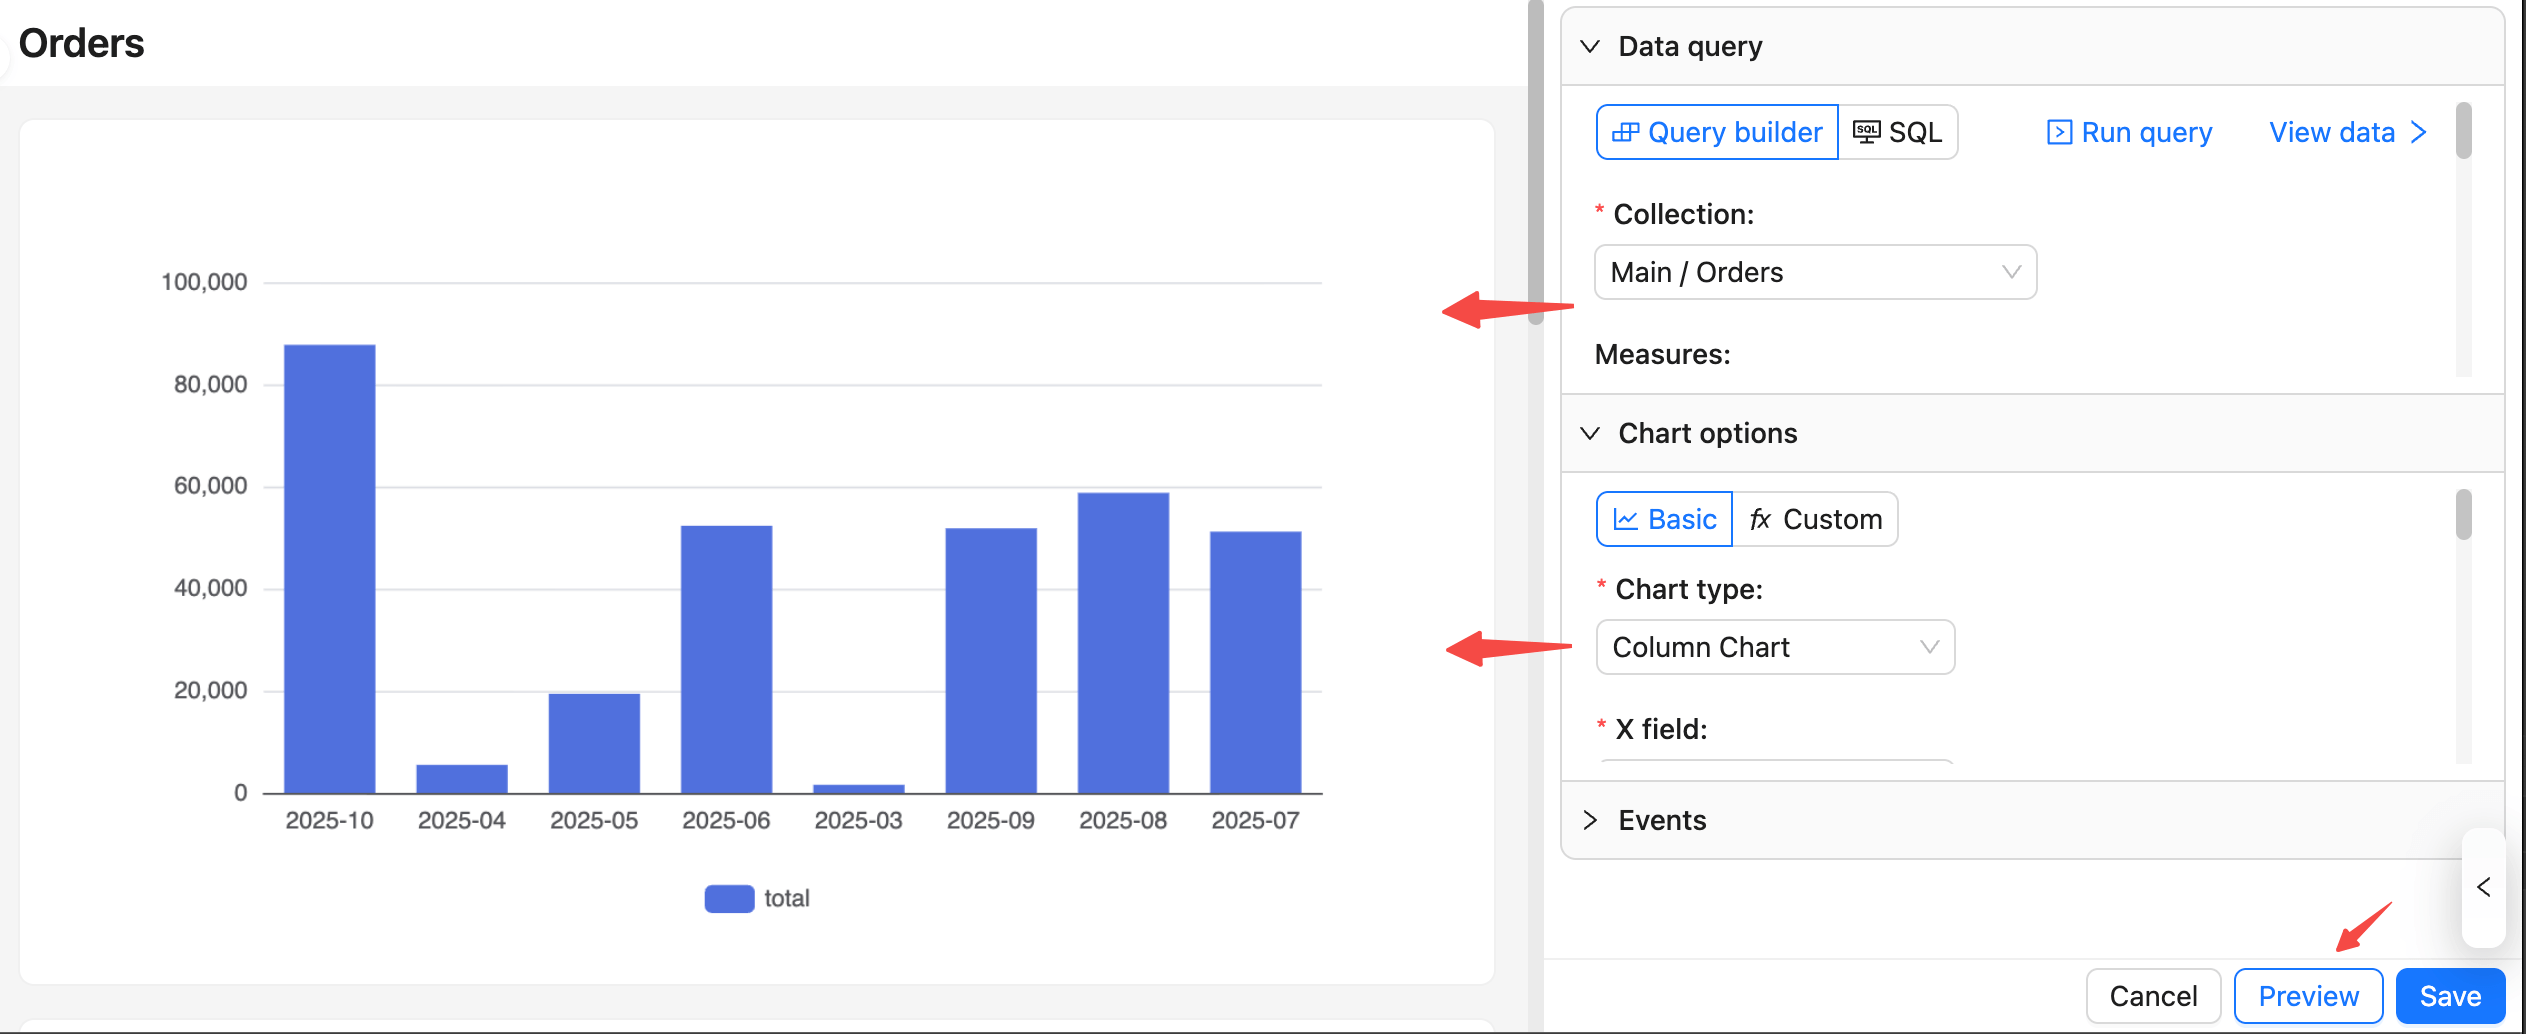
Configure data query
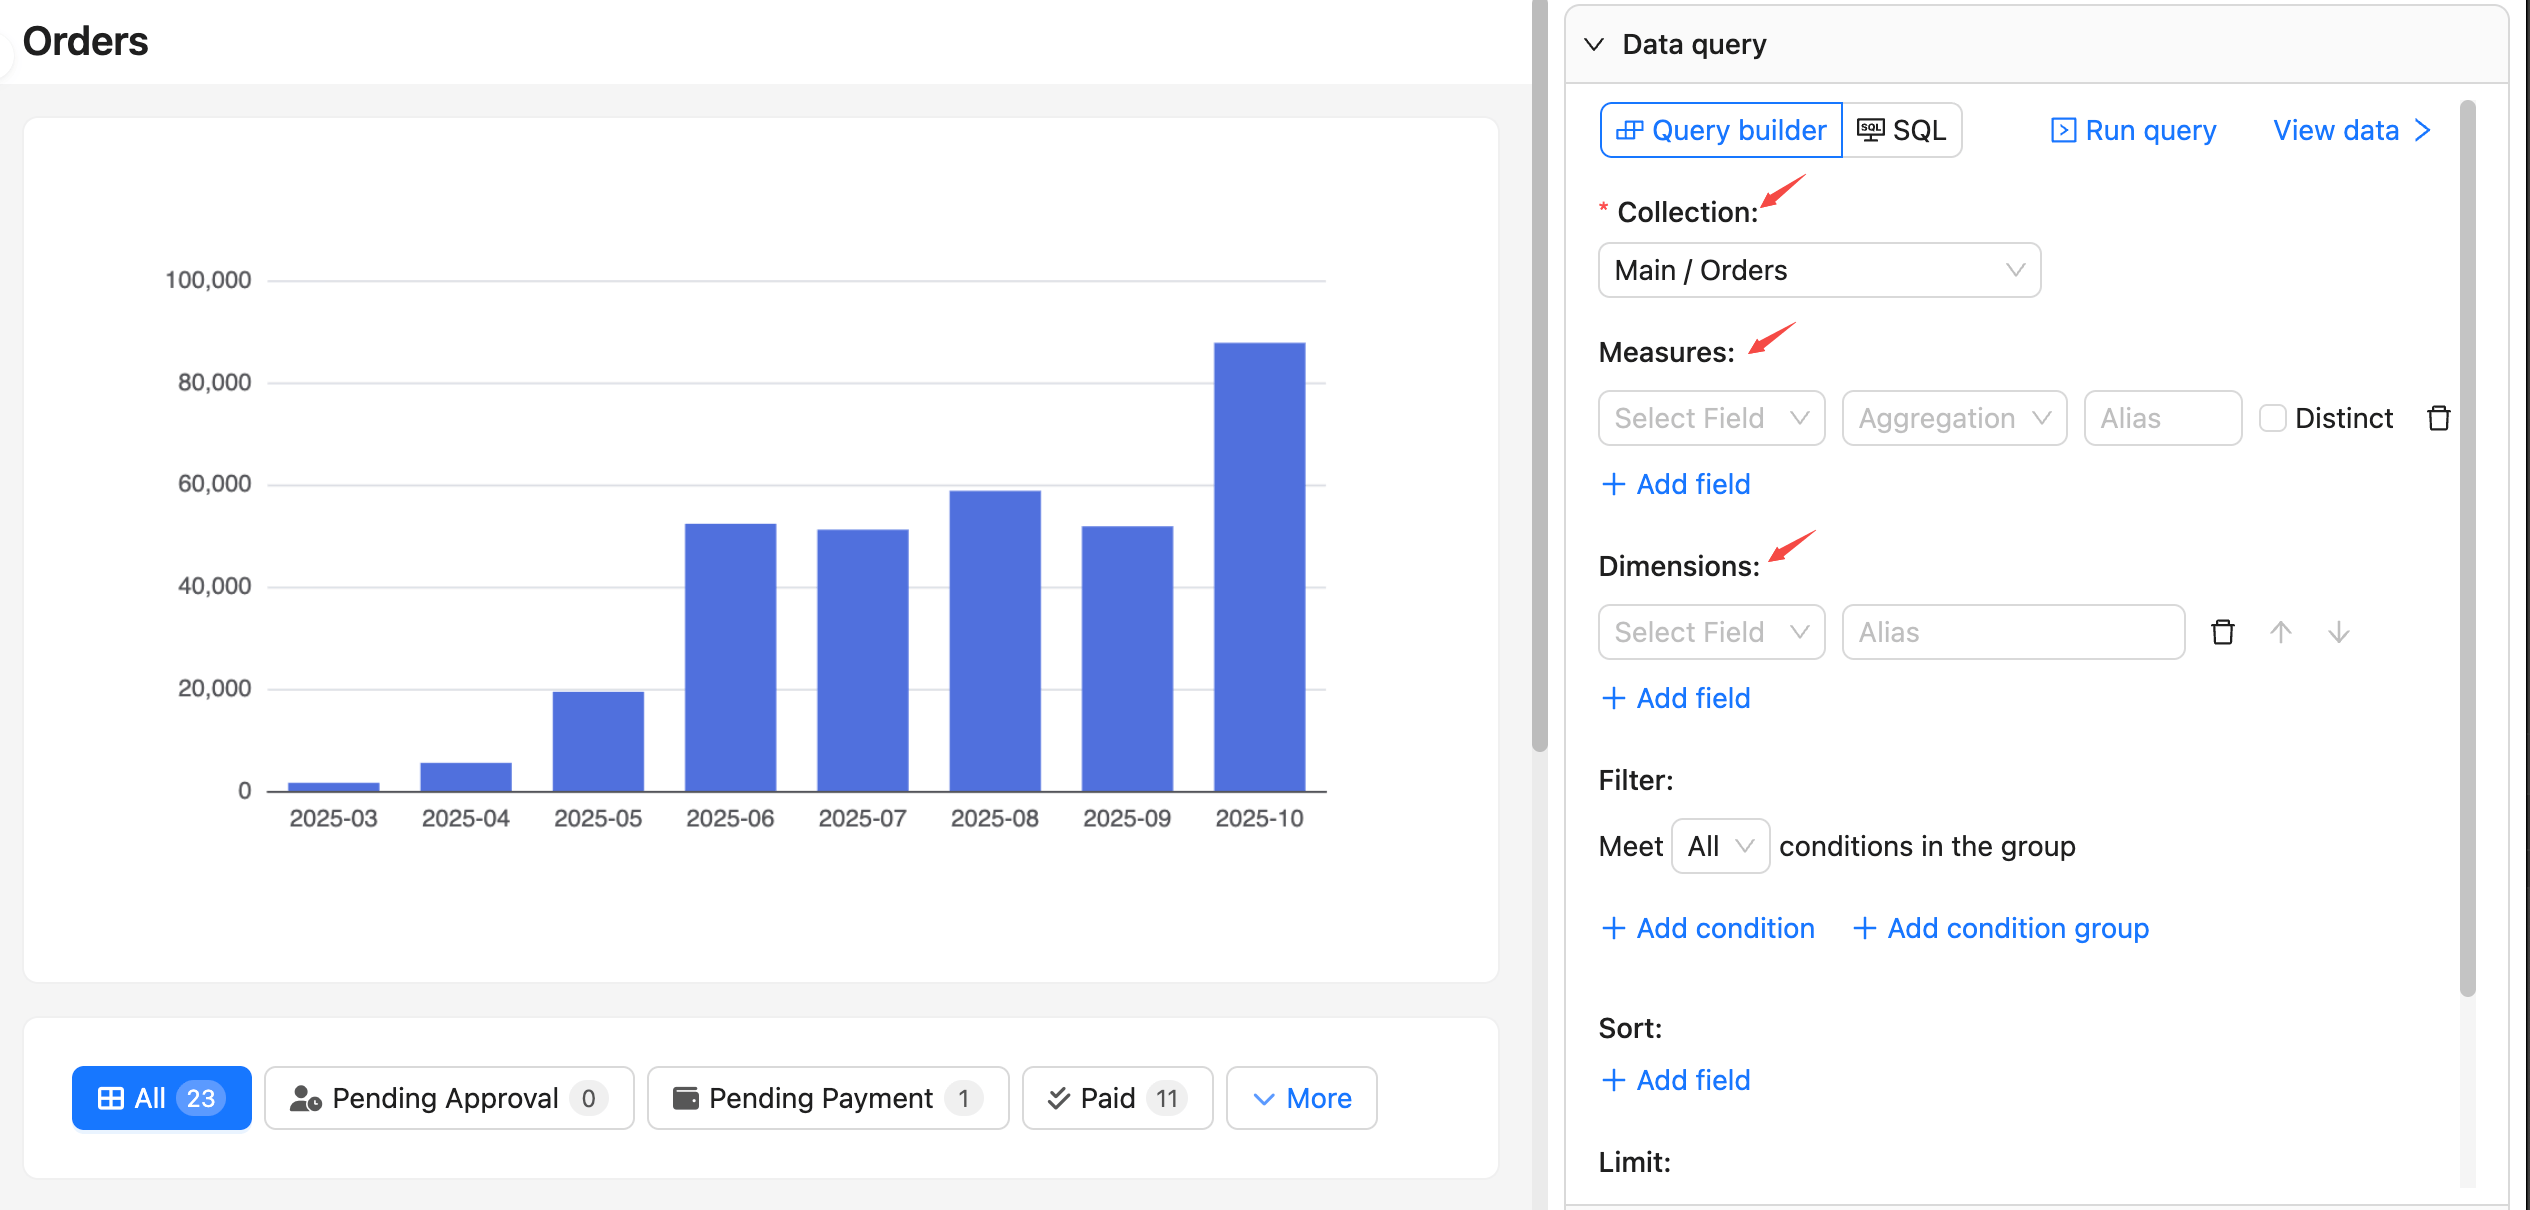
In the data query panel, configure the data source, query filters, and related options.
-
Select data source and collection
- Choose the data source and collection as the base for querying.
- If the collection is not selectable or empty, first check whether it exists and whether your user has permission.
-
Configure measures
- Select one or more numeric fields as measures.
- Set aggregation for each measure: sum / count / avg / max / min.
-
Configure dimensions
- Select one or more fields as grouping dimensions (date, category, region, etc.).
- For date/time fields, set a format (for example,
YYYY-MM,YYYY-MM-DD) to keep the display consistent.
Other options like filter, sort, and pagination are optional.
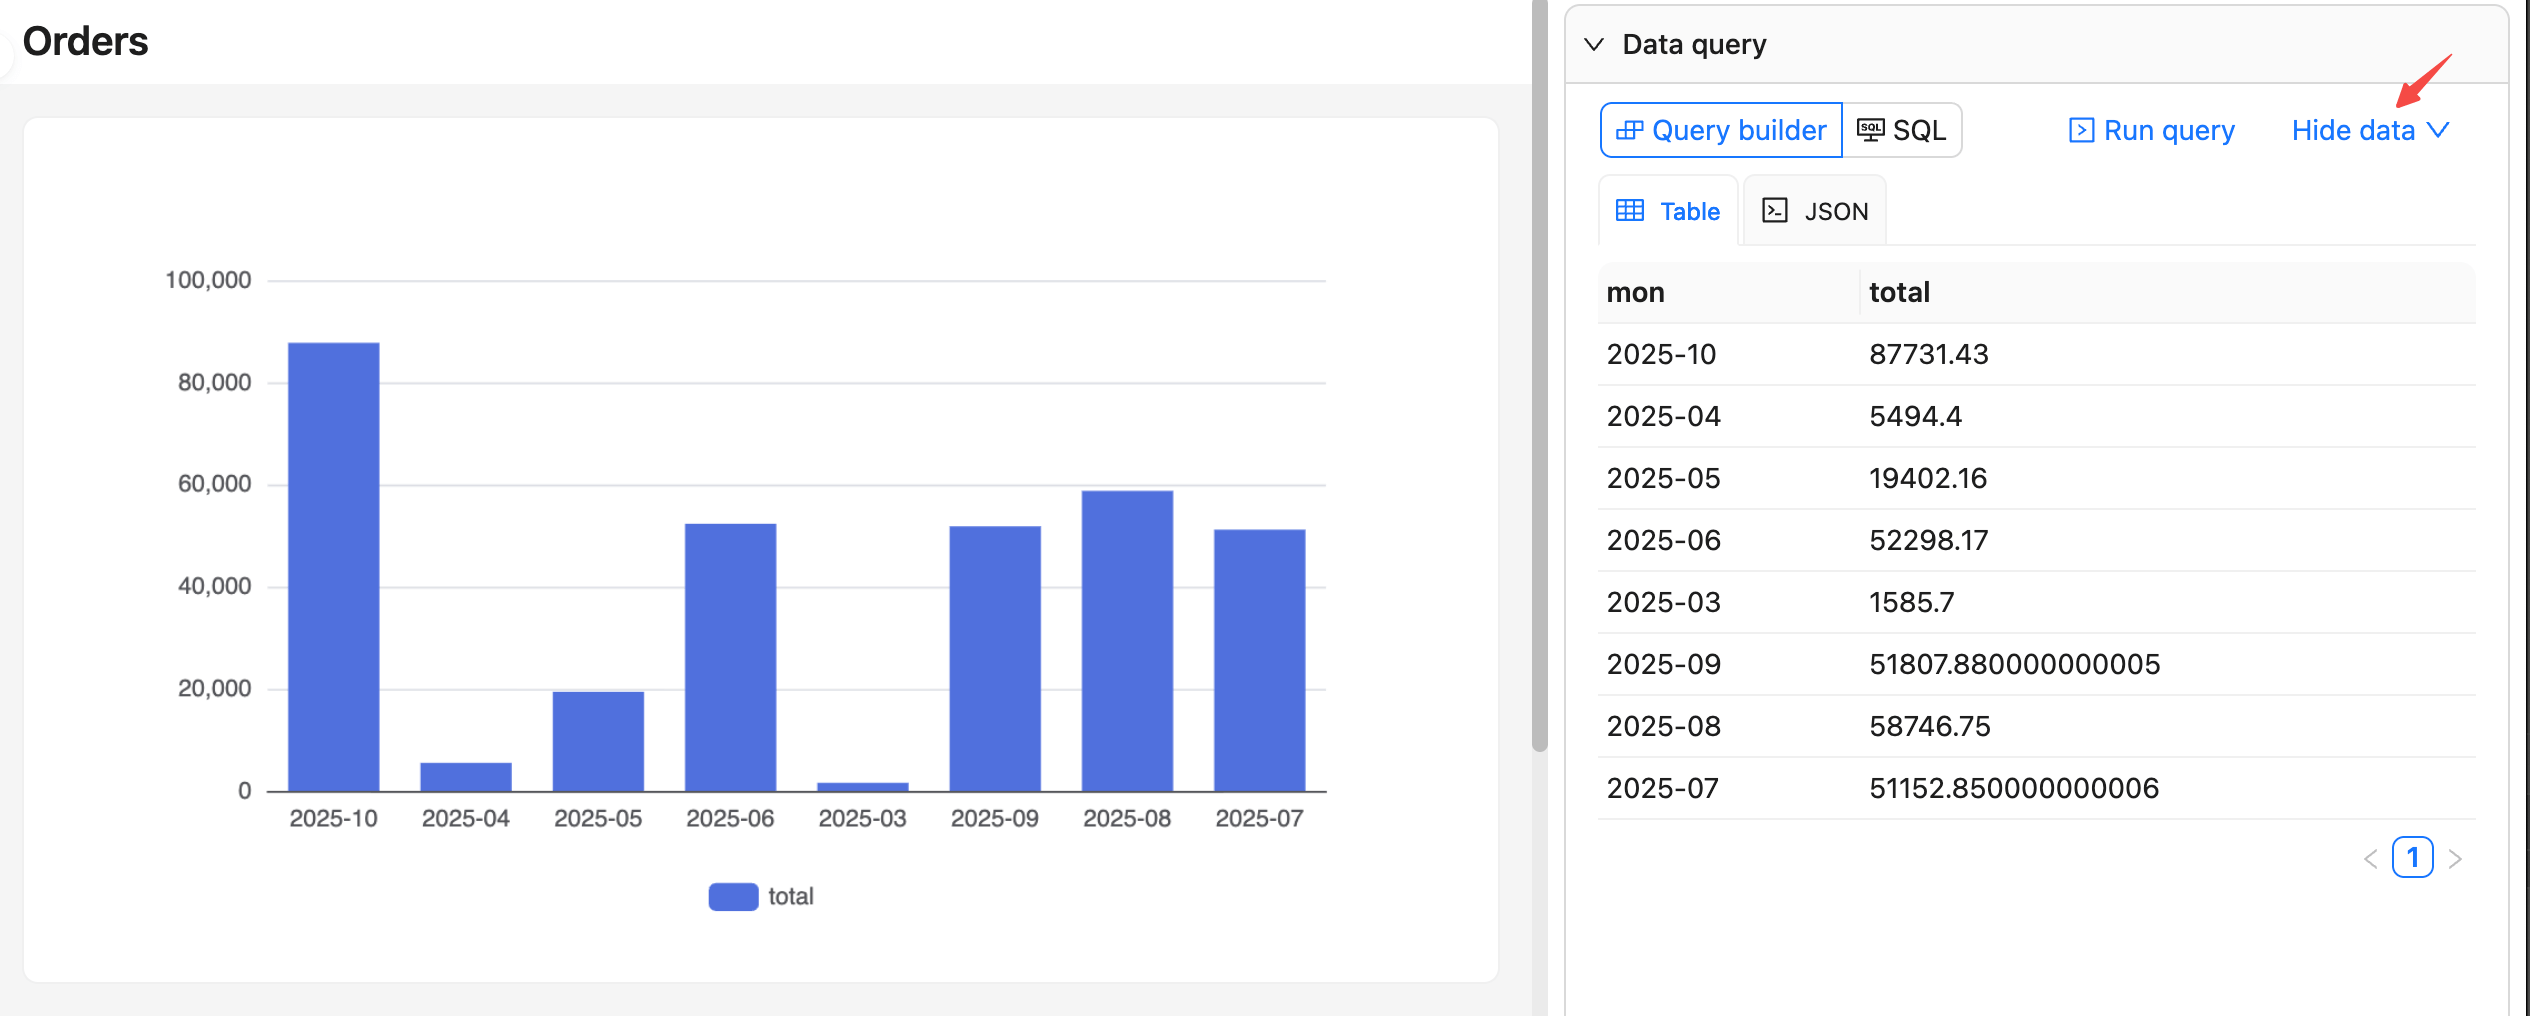
Run query and view data
- Click “Run query” to fetch data and render a preview chart directly on the left.
- Click “View data” to preview the returned data; you can switch between table and JSON formats. Click again to collapse the preview.
- If the result is empty or unexpected, return to the query panel and check collection permissions, field mappings for measures/dimensions, and data types.
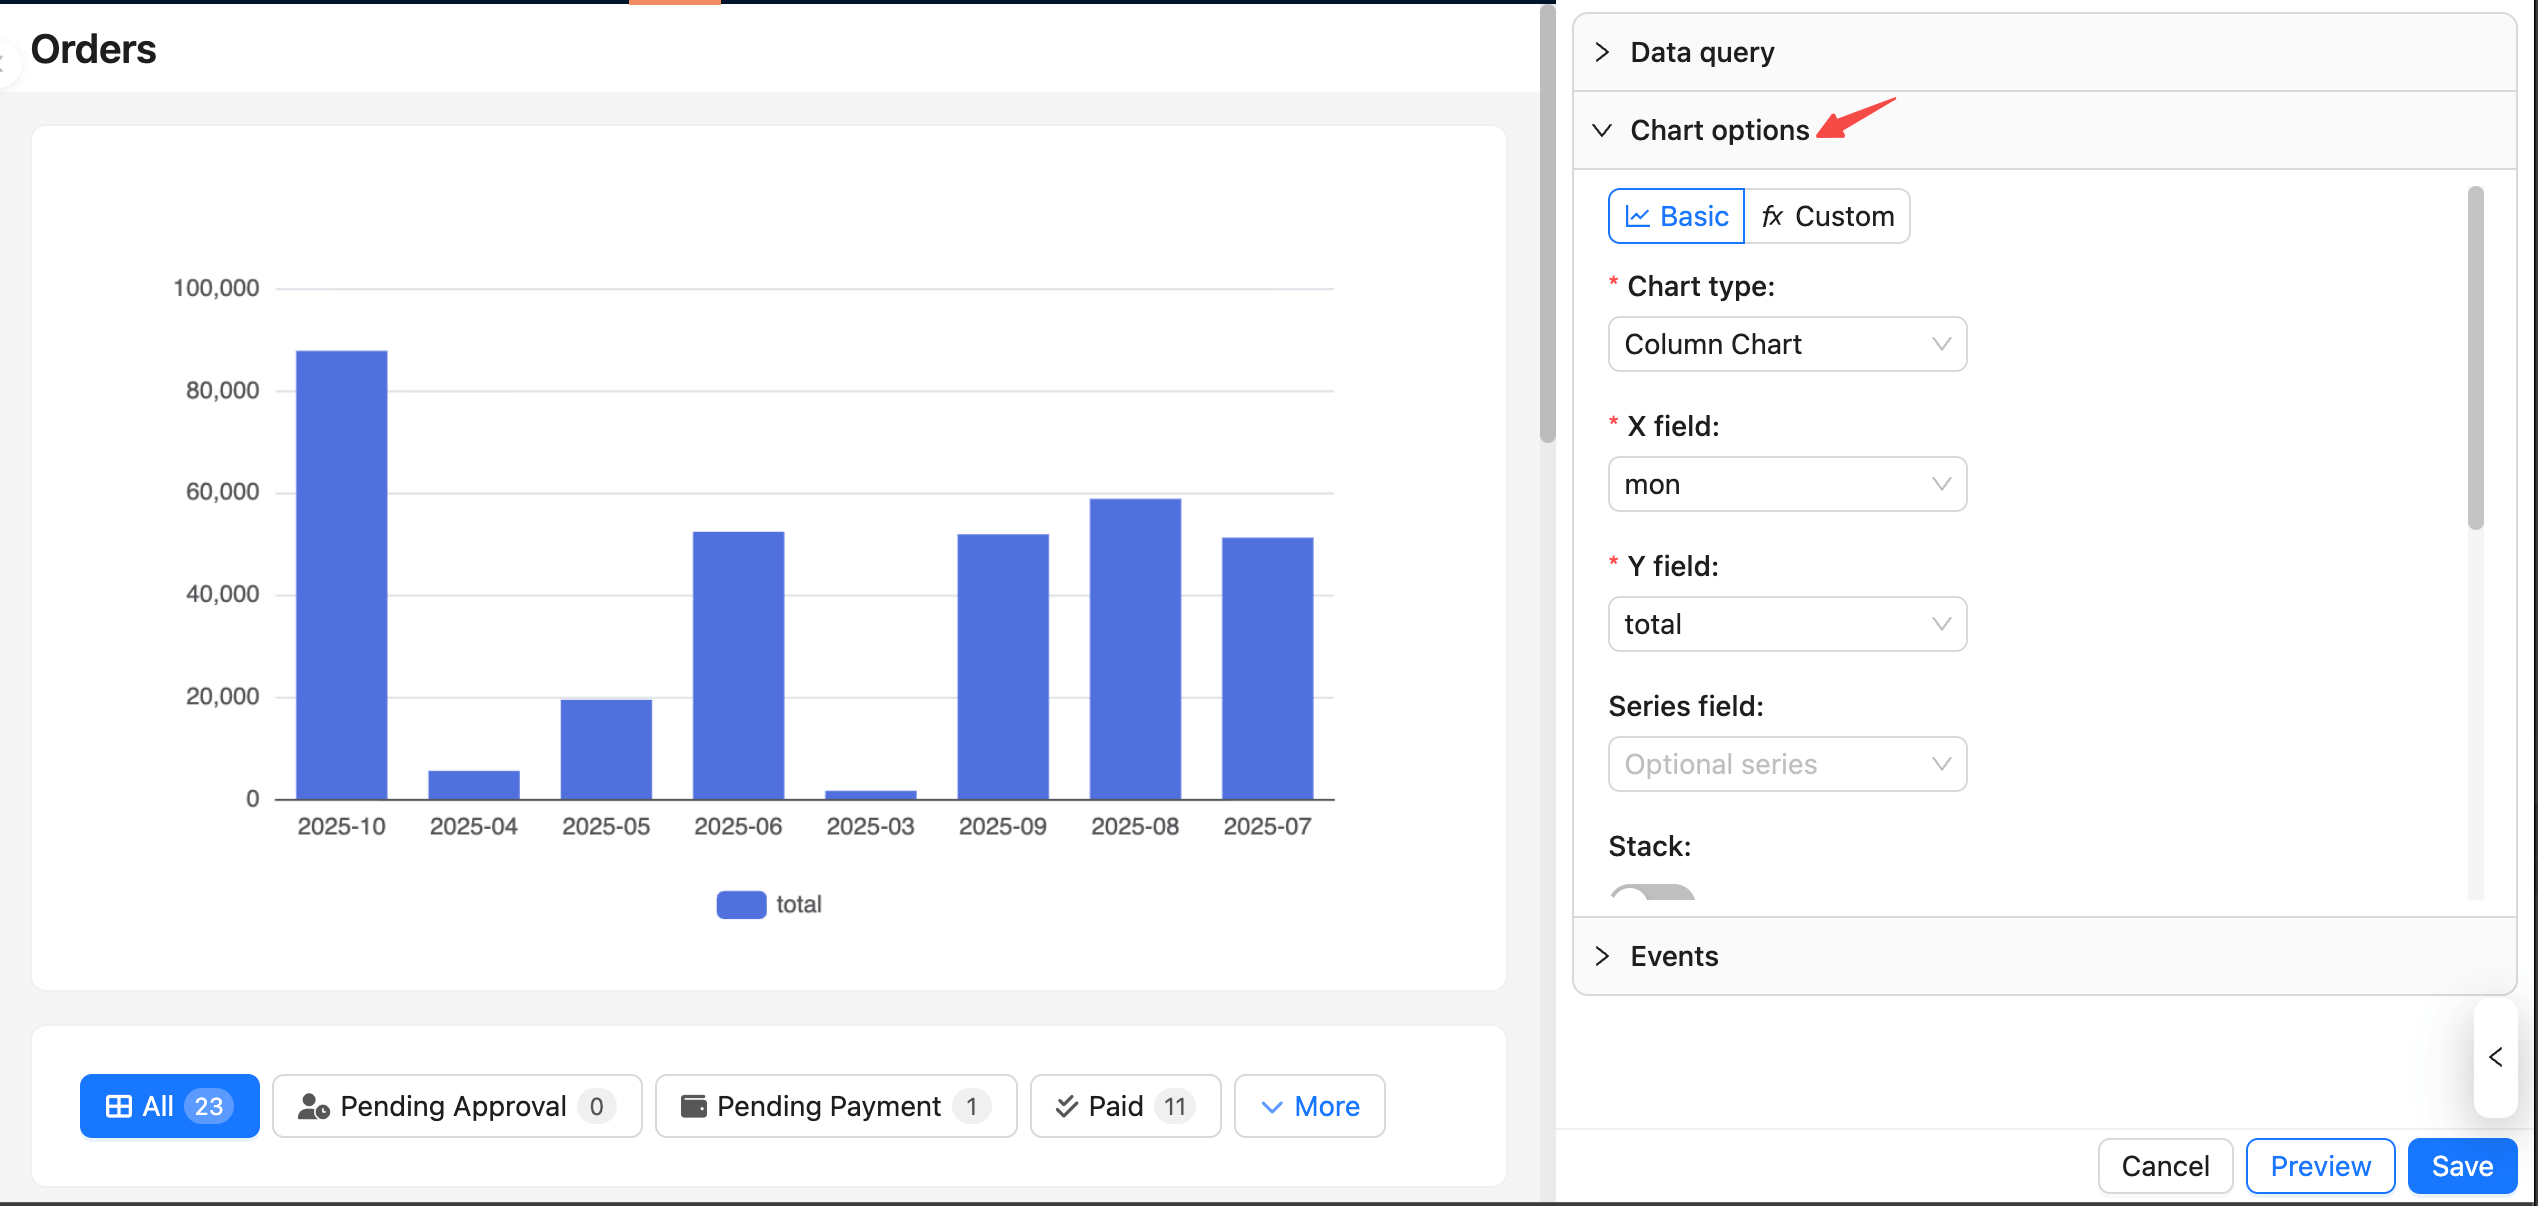
Configure chart options
In the chart options panel, choose the chart type and configure its options.
- First select a chart type (line/area, column/bar, pie/donut, scatter, etc.).
- Complete the core field mappings:
- Line/area/column/bar:
xField(dimension),yField(measure),seriesField(series, optional) - Pie/donut:
Category(categorical dimension),Value(measure) - Scatter:
xField,yField(two measures or dimensions) - For more chart settings, refer to the ECharts docs: Axis
- Line/area/column/bar:
- After “Run query”, field mappings are auto‑filled by default. If you change dimensions/measures, recheck the mappings.
Preview and Save
Changes update the preview in real time on the left, but they are not saved until you click “Save”.
You can also use the buttons at the bottom:
- Preview: Configuration changes refresh the preview automatically, or click “Preview” to trigger a refresh manually.
- Cancel: If you don’t want the current changes, click “Cancel” at the bottom or refresh the page to revert to the last saved state.
- Save: Click “Save” to persist the current query and chart configuration to the database; it becomes effective for all users.
Common tips
- Minimum viable setup: Select a collection plus at least one measure; adding dimensions is recommended for grouped display.
- For date dimensions, set an appropriate format (for example, monthly
YYYY-MM) to avoid a discontinuous or messy X‑axis. - If the query is empty or the chart does not display:
- Check the collection/permissions and field mappings.
- Use “View data” to confirm column names and types match the chart mapping.
- Preview is temporary: It is for validation and adjustments. It only takes effect after you click “Save”.