

Data query
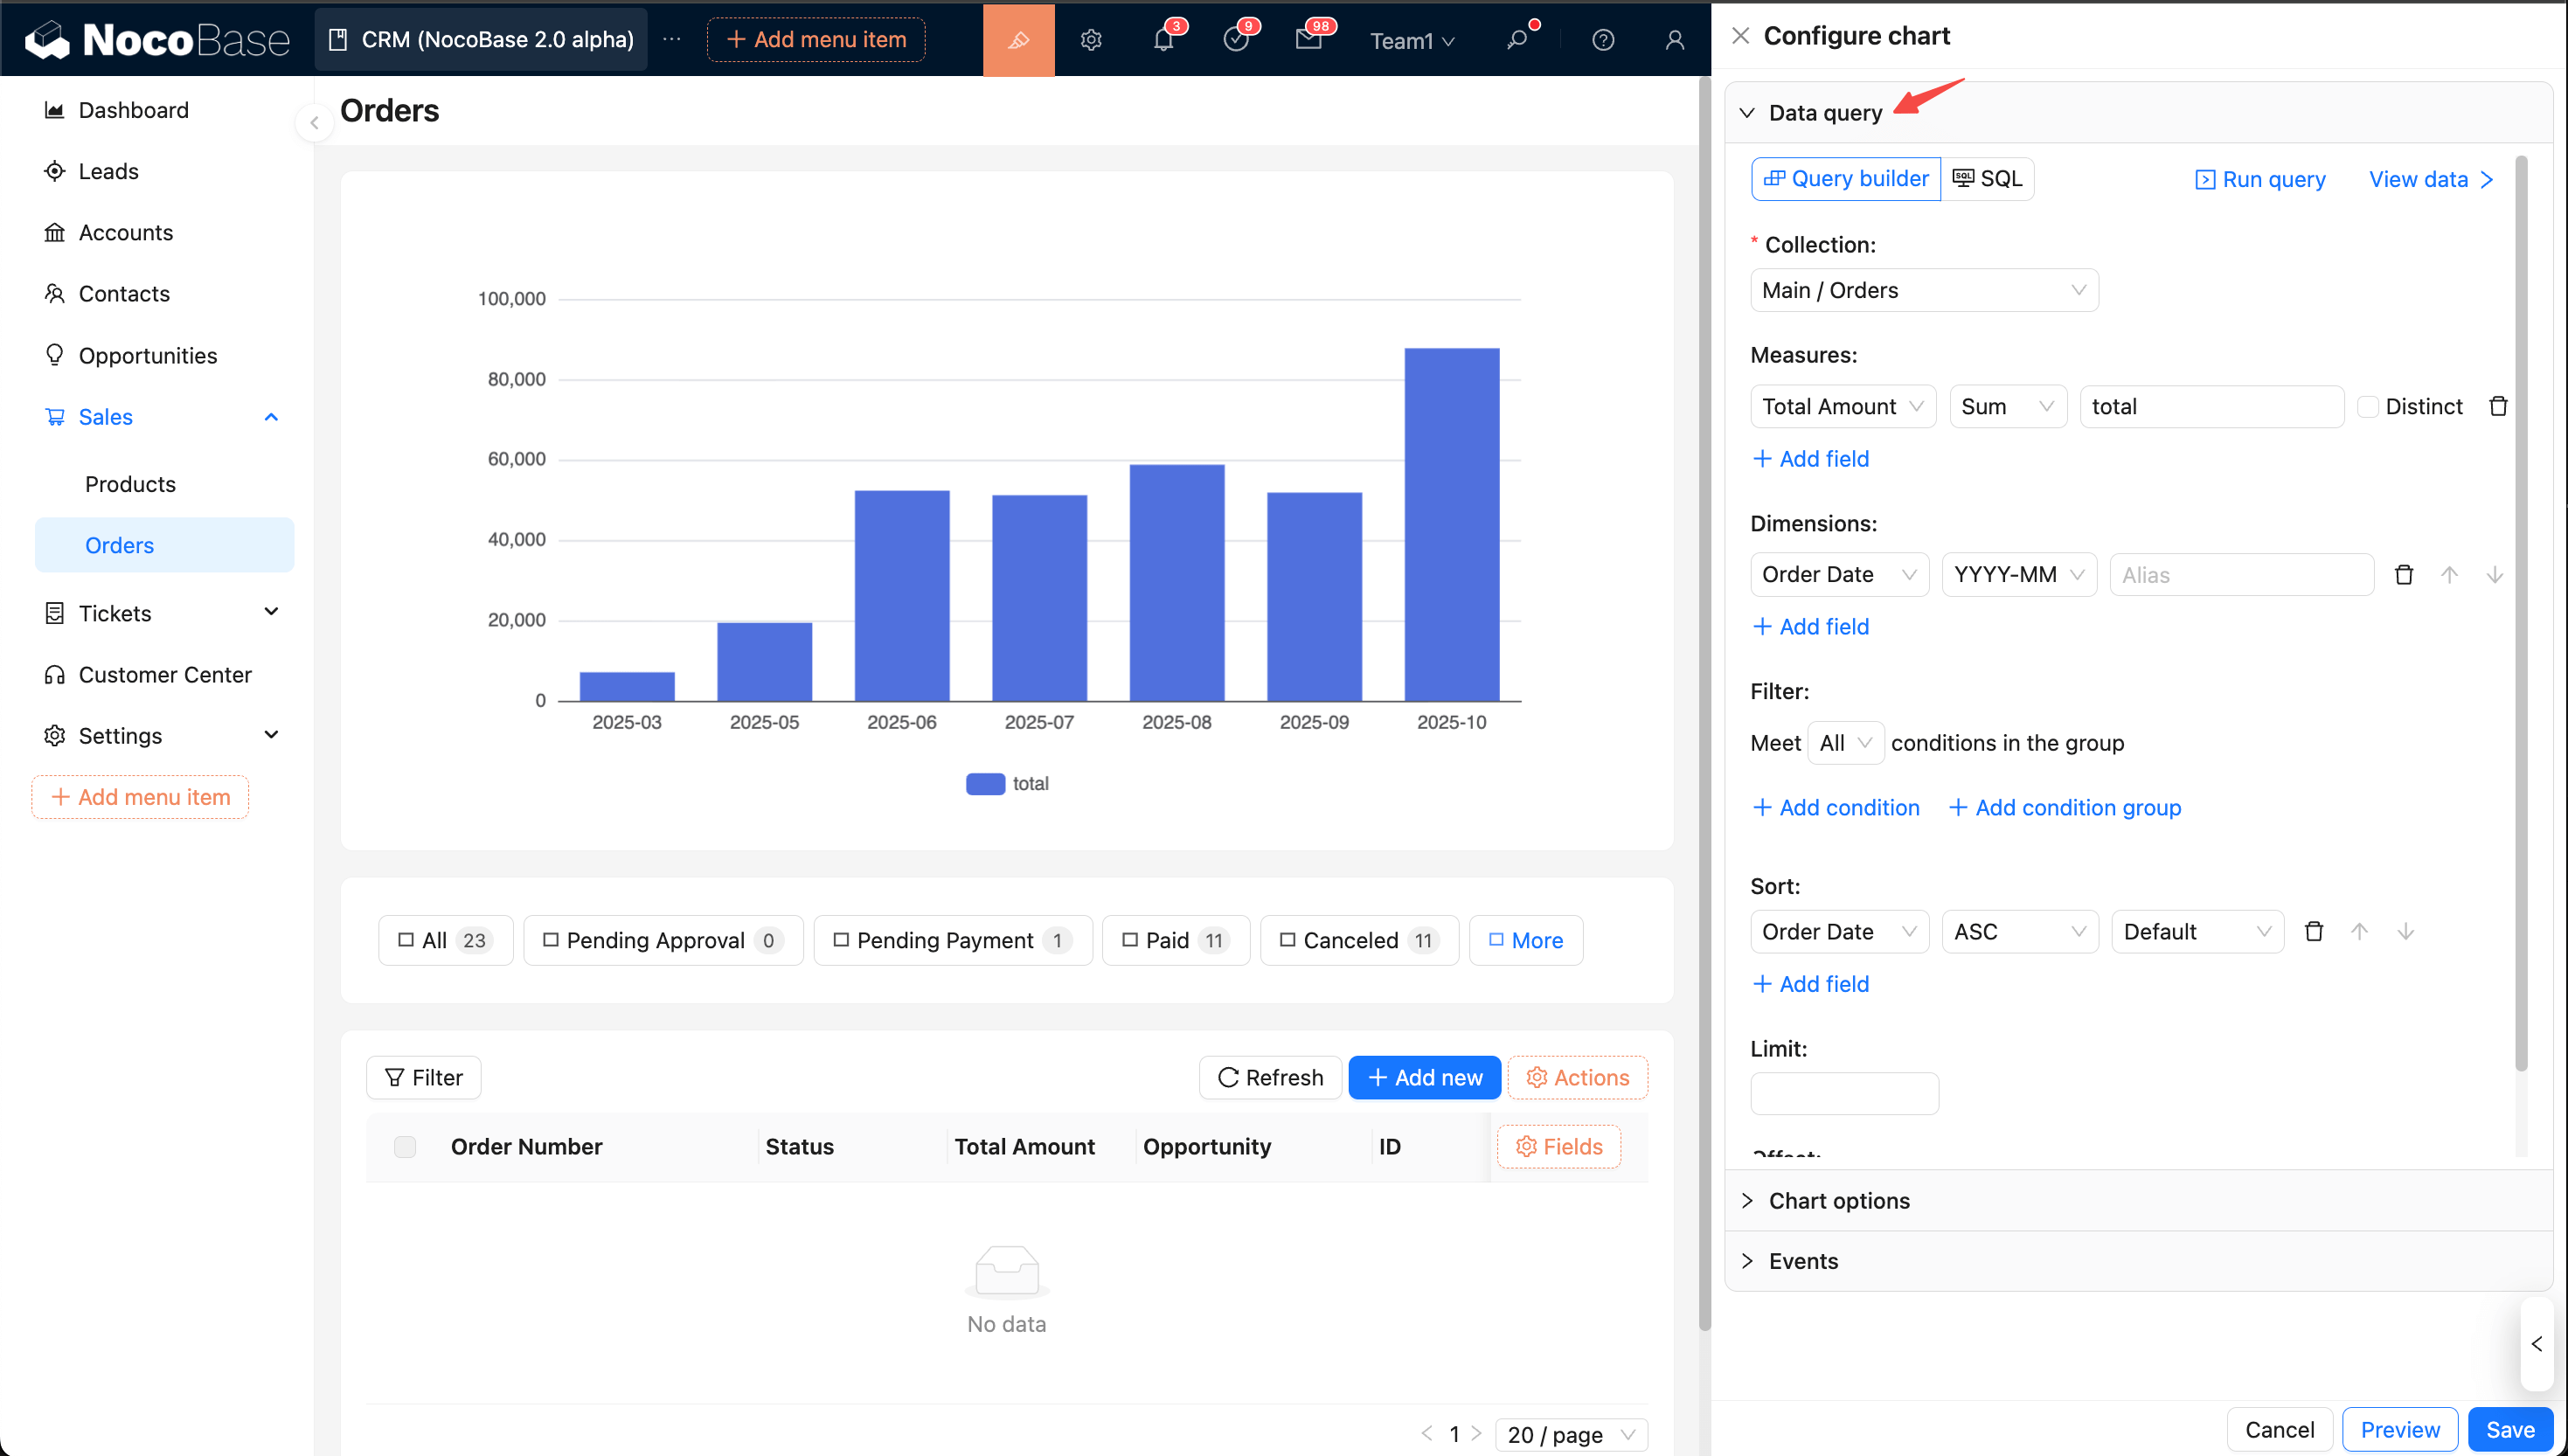
The chart configuration panel is divided into three sections: Data query, Chart options, and Interaction events, plus Cancel, Preview, and Save buttons at the bottom.
Let's first look at the "Data query" panel to understand the two query modes (Builder/SQL) and their common features.
Panel Structure
Tips: To configure the current content more easily, you can collapse other panels first.
The top is the action bar:
- Mode: Builder (graphical, simple, and convenient) / SQL (handwritten statements, more flexible).
- Run query: Click to execute the data query request.
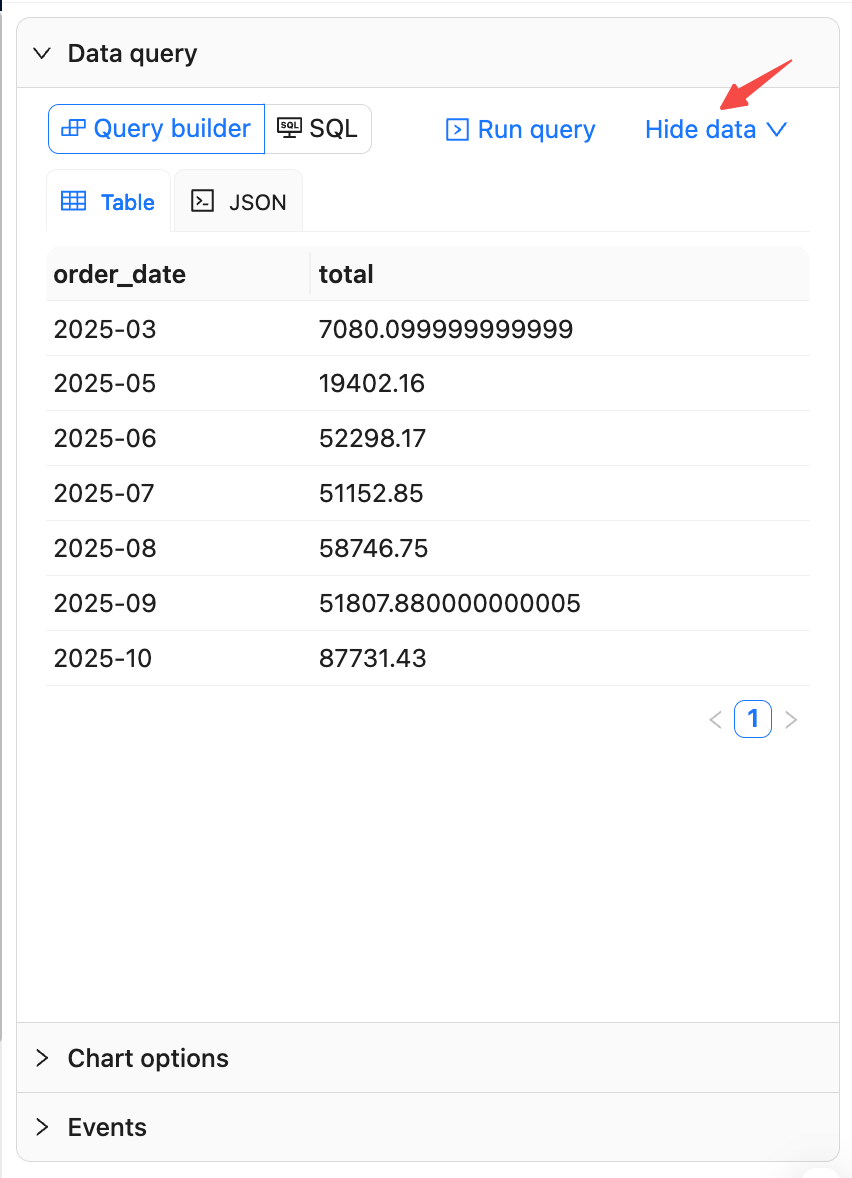
- View result: Opens the data result panel, where you can switch between Table/JSON views. Click again to collapse the panel.
From top to bottom:
- Data source and collection: Required. Select the data source and collection.
- Measures: Required. The numeric fields to be displayed.
- Dimensions: Group by fields (e.g., date, category, region).
- Filter: Set filter conditions (e.g., =, ≠, >, <, contains, range). Multiple conditions can be combined.
- Sort: Select the field to sort by and the order (ascending/descending).
- Pagination: Control the data range and return order.
Builder mode
Select data source and collection
- In the "Data query" panel, set the mode to "Builder".
- Select a data source and collection. If the collection is not selectable or is empty, first check permissions and whether it has been created.
Configure Measures
- Select one or more numeric fields and set an aggregation:
Sum,Count,Avg,Max,Min. - Common use cases:
Countto count records,Sumto calculate a total.
Configure Dimensions
- Select one or more fields as grouping dimensions.
- Date and time fields can be formatted (e.g.,
YYYY-MM,YYYY-MM-DD) to facilitate grouping by month or day.
Filter, Sort, and Pagination
- Filter: Add conditions (e.g., =, ≠, contains, range). Multiple conditions can be combined.
- Sort: Select a field and the sort order (ascending/descending).
- Pagination: Set
LimitandOffsetto control the number of returned rows. It's recommended to set a smallLimitwhen debugging.
Run Query and View Result
- Click "Run query" to execute. After it returns, switch between
Table / JSONin "View result" to check the columns and values. - Before mapping chart fields, confirm the column names and types here to avoid an empty chart or errors later.
Subsequent Field Mapping
Later, when configuring "Chart options", you will map fields based on the fields from the selected data source and collection.
SQL mode
Write Query
- Switch to "SQL" mode, enter your query statement, and click "Run query".
- Example (total order amount by date):
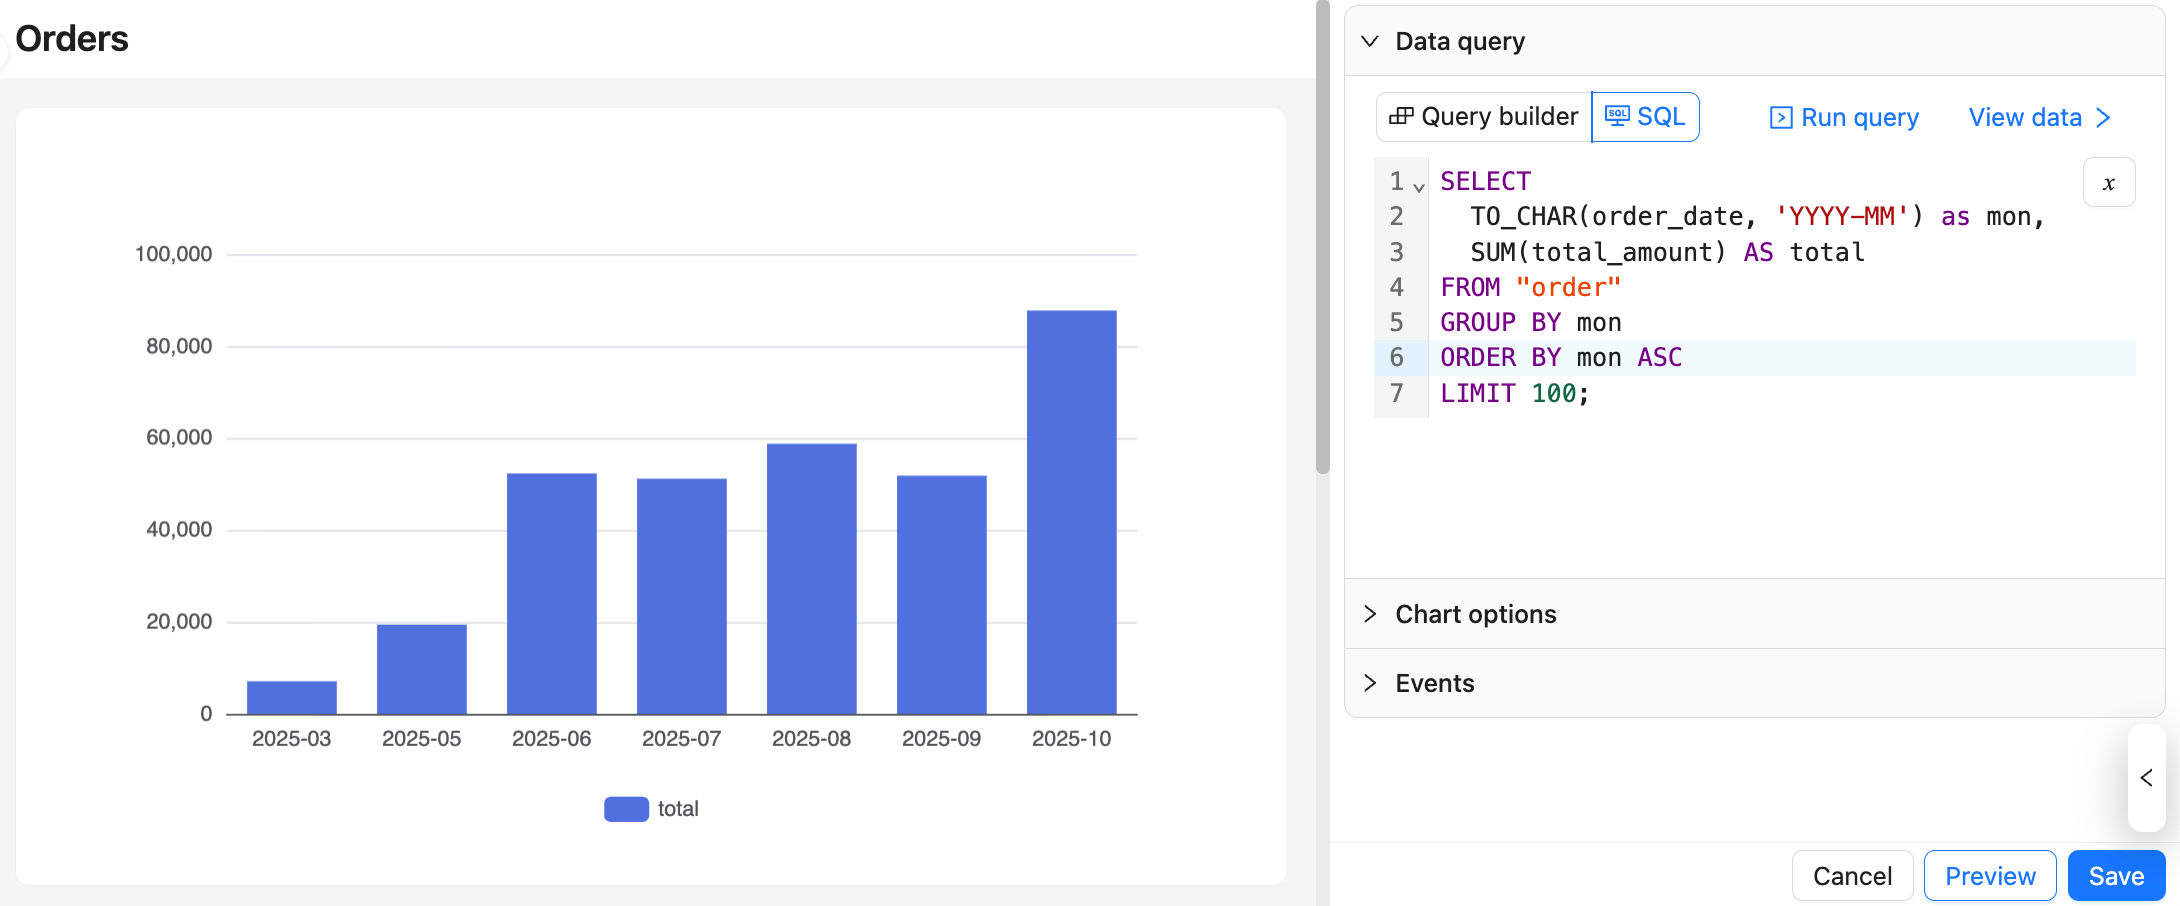
Run Query and View Result
- Click "Run query" to execute. After it returns, switch between
Table / JSONin "View result" to check the columns and values. - Before mapping chart fields, confirm the column names and types here to avoid an empty chart or errors later.
Subsequent Field Mapping
Later, when configuring "Chart options", you will map fields based on the columns from the query result.
TIP
For more information on SQL mode, please see Advanced Usage — Query Data in SQL Mode.