AI Employee · Viz: Insight Analyst
Generate charts and insights with one click, and let the data speak for itself.
1. Who is Viz
Viz is a built-in AI Insight Analyst. He can read the data on your current page (such as Leads, Opportunities, Accounts) and automatically generate trend charts, comparison charts, KPI cards, and concise conclusions, making business analysis easy and intuitive.
He is not just a cold reporting tool, but an analyst who can understand questions and tell stories.
💡 Want to know "why sales have recently declined"? Just say a sentence to Viz, and he can tell you where the decline occurred, what the possible reasons are, and what steps you can take next.
2. What you can do with Viz
| Capability | Description | Example |
|---|---|---|
| 📊 Auto-generate charts | Visualize data with one click, no SQL required | "Generate this month's sales trend" |
| 🔍 Discover changes and anomalies | Analyze the reasons for increases or decreases | "How is this month better than last month?" |
| 🧭 Assist in decision-making | Provide actionable suggestions based on data | "Which channel is most worth increasing the budget for?" |
| 🧩 Aggregate data perspectives | Compare across multiple dimensions like region, product, source | "Show revenue comparison by region" |
Whether it's for monthly business reviews, channel ROI, or sales funnels, Viz can generate charts and interpretations in seconds.
3. How to Use
3.1 Page Entry Points
-
Top-right button (Recommended) In the top-right corner of pages like Leads, Opportunities, and Accounts, click the Viz icon to select preset tasks, such as:
- Stage conversion and trends
- Source channel comparison
- Monthly review analysis
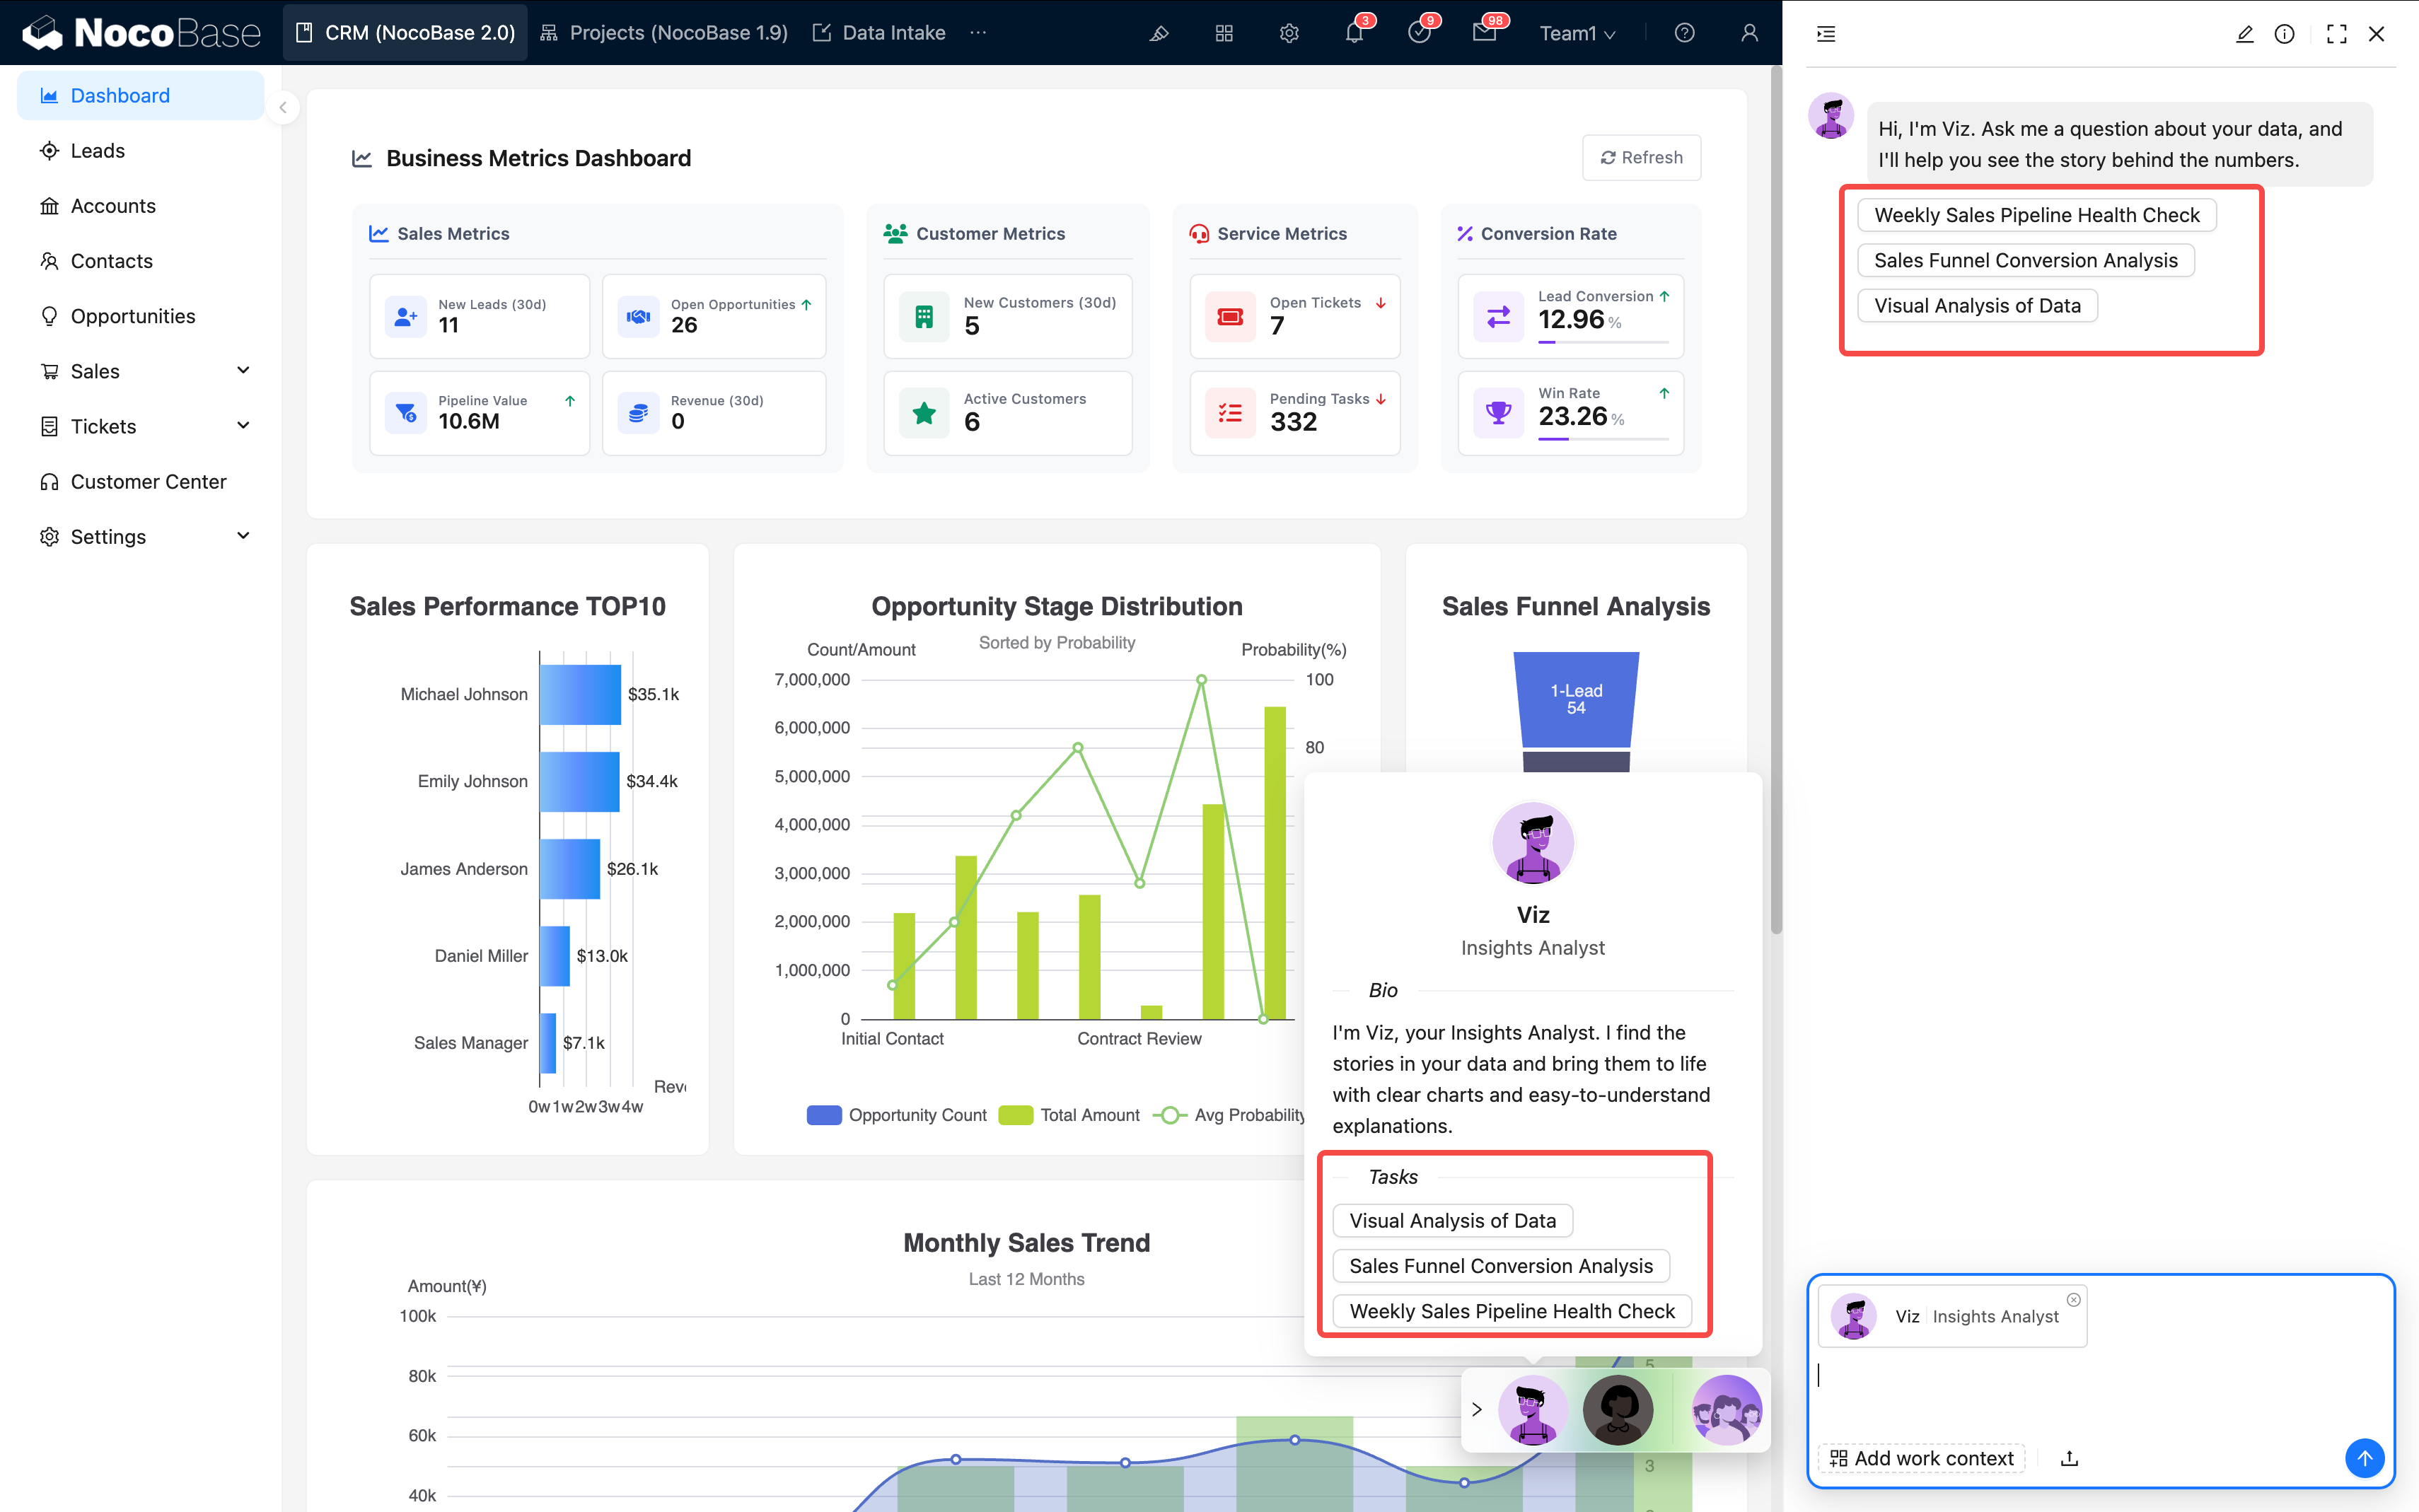
-
Bottom-right global panel No matter which page you are on, you can bring up the global AI panel and speak directly to Viz:
Viz will automatically use the data context of your current page.
3.2 Interaction Method
Viz supports natural language questions and can understand multi-turn follow-up questions. Example:
Each follow-up question will delve deeper based on the previous analysis results, without needing to re-enter data conditions.
4. Common Analysis Scenarios
| Scenario | What you want to know | Viz's output |
|---|---|---|
| Monthly Review | How is this month better than last month? | KPI card + Trend chart + Three improvement suggestions |
| Growth Breakdown | Is the revenue increase due to a change in volume or price? | Factor decomposition chart + Comparison table |
| Channel Analysis | Which channel is most worth continued investment? | ROI chart + Retention curve + Suggestions |
| Funnel Analysis | Where is the traffic getting stuck? | Funnel chart + Bottleneck explanation |
| Customer Retention | Which customers are the most valuable? | RFM segmentation chart + Retention curve |
| Promotion Evaluation | How effective was the big promotion? | Comparison chart + Price elasticity analysis |
📈 All charts are generated in valid ECharts format, with one key point per chart, and are accompanied by a brief conclusion. If there is insufficient data, Viz will state it directly rather than fabricating results.
5. Tips for Chatting with Viz
| Practice | Effect |
|---|---|
| ✅ Specify a time range | "Last 30 days," "last month vs. this month" for more accuracy |
| ✅ Specify dimensions | "By region/channel/product" helps align perspectives |
| ✅ Focus on trends, not details | Viz excels at identifying the direction of change and key reasons |
| ✅ Use natural language | No need for command-style syntax, just ask as if you were chatting |
6. Who is Viz Best For?
| Role | Use Case |
|---|---|
| Sales Manager | View stage conversion rates, channel performance, team results |
| Marketer | Analyze ad spend ROI, promotion effectiveness, customer retention |
| Operations Analyst | Quickly pull data, discover anomalies, validate hypotheses |
| Management | Understand business status at a glance, get signals for decision-making |
7. Usage Suggestions
-
Start with preset tasks The official demo has built-in common tasks, so you can experience the results directly without needing prompts. For example: Leads page → Click Viz → Stage conversion and trends
-
Observe the output style Each analysis point has a separate chart and a brief description. Clear charts and concise text are Viz's standard output.
-
Ask follow-up questions progressively After reading the analysis report, continue to ask "why" and "how to improve," and Viz will automatically follow up.
8. Summary
- Viz = Your data insight assistant
- No need to write SQL or configure charts
- Get an analysis report with a single natural language sentence
- All conclusions are based on real data, clear and credible
Start with Leads → Viz → Stage conversion and trends, seeing the first chart is the best starting point for understanding this AI Employee.